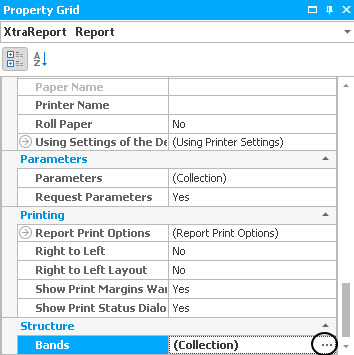
First, you click on the row Bands in the section Structure. Three dots will appear, please click on them:
The following window opens:
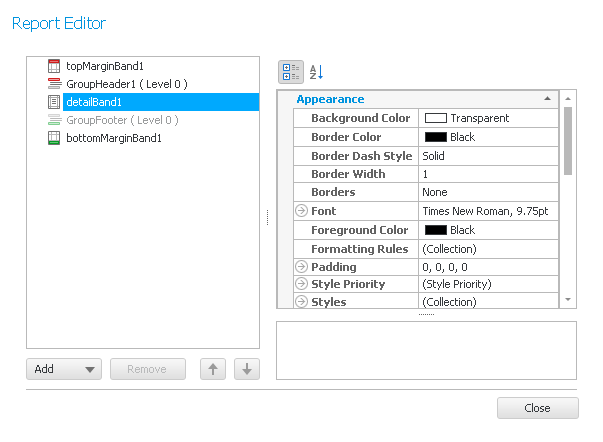
Here you can create new bands by clicking on Add. A list appears where you can choose the band type you want. On the right you have the possibility to adjust the settings for the individual bands. The explanations therefore can be found in the chapter Bands. If you want to delete a band, select it and click on Remove. There is also the possibility to change the order of the bands. For that, click on the band you want to move and then on the 
 buttons.
Once you set everything go on Close.
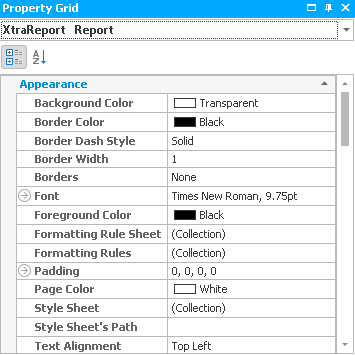
Explanations for the section Appearance can be found in the chapter Text Element.
In the last row of the section Appearance you can create and edit a watermark. Open the settings by clicking on the arrow in front of watermark:
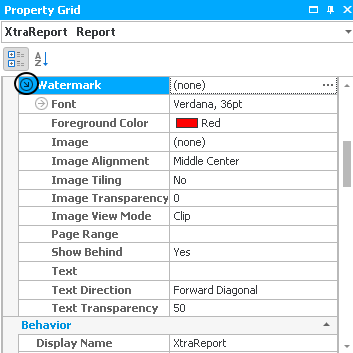
Now you go on the three dots and the following dialog appears:

You can read about how to adjust the settings here in the chapter Display Window.
Once you set everything click on OK.
For a picture you can change the Image View Mode.
Click on the row Image and then on the three dots. The following window opens:
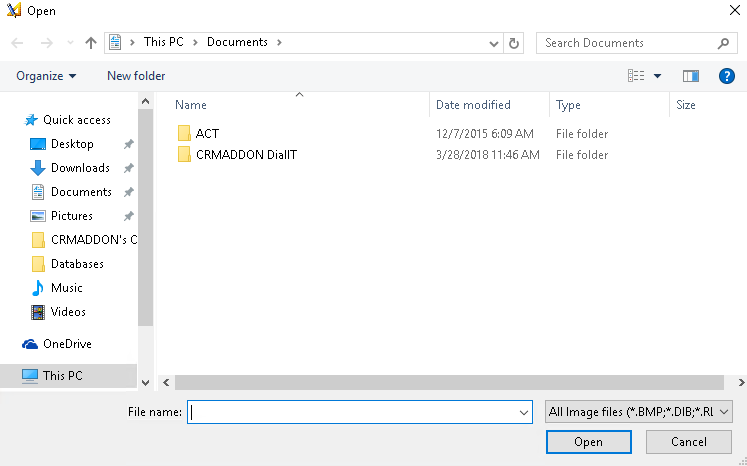
Choose a picture for the watermark and then go on Open. You have inserted a picture as your watermark now.
Next, you enter the Image Alignment and if there should be Image Tiling. Then you state a number from 0 to 255 for Image Transparency, 0 means not transparent at all and 255 means not visible anymore. For Show behind you pick Yes.
If you created a text as a watermark you have the possibility to change the Font. Click on the row and then on the three dots. The following dialog appears:
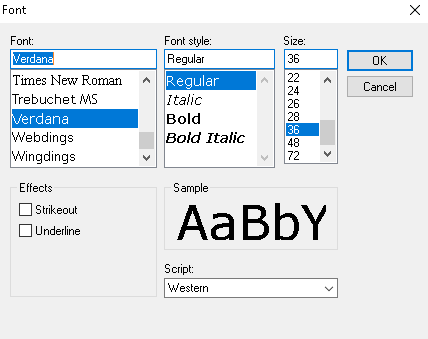
After setting the font, the font style, the size, the effects and the script click on OK.
In the row Text you either choose one from the list or type in a text. There is also the possibility to change the Text Direction for the watermark, for example Forward Diagonal or Horizontal. Like for the picture, you are able to adjust the transparency. Enter a number from 0 to 255, with 0 meaning not transparent at all and 255 meaning not visible. In the end, you state the color of the text.
These were the settings of the section Appearance.
In the next section Data you can edit the calculated fields that you have previously created by clicking on the row Calculated fields and then on the three dots:
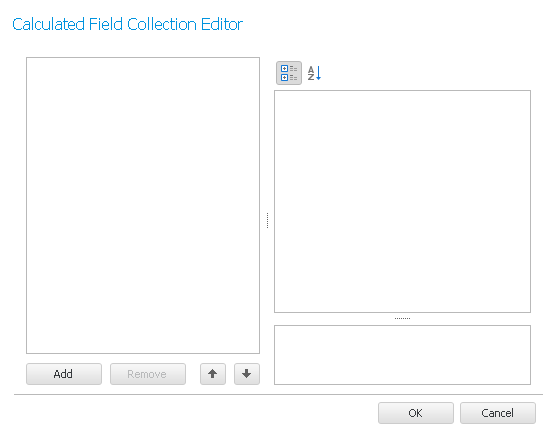
You can read more about it in the chapter List of fields. After you finished editing the list you click on OK.
Next, you enter dataSet1 for the data source, this is the connection to Act!.
Furthermore, you have the possibility to apply a filter to the content of the fields you want to insert. This is useful, for example, when you want to address only all of the customers in an e-mail and not all of your contacts in Act!. Click on the row Filter String and then on the three dots. the following dialog appears:
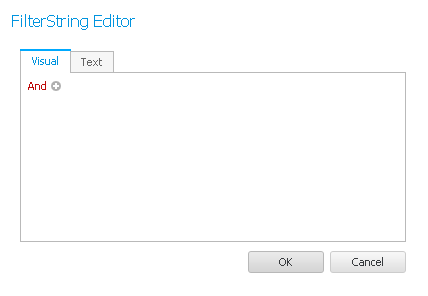
If you know a bit about coding you click on the tab Text and enter your desired filter. Under the tab Visual, however, you can easily create a filter- First, go on the "+" behind and:

Then you click on the words in blue:

Choose a field from the list the filter should apply to. Then you go on the green lettering:
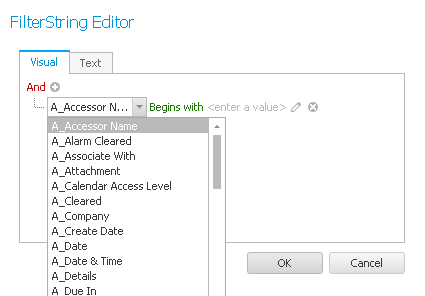
Now choose an operator for your filter, meaning the condition that should apply to this field.
Then click on Enter a value. Depending on the field type you enter a date, a time, a number, a character string or true/false.
The pen symbol makes it possible to compare the value of the first field with the value of a different field instead of with a solid value you entered yourself.

With the X next to the row you can delete the filter condition. You add new ones with the + next to the and. Once you completed your filter you go on OK.
Now comes the section Design. First, you enter a name for the report.
Then you click on the arrow in front of Designer Options:
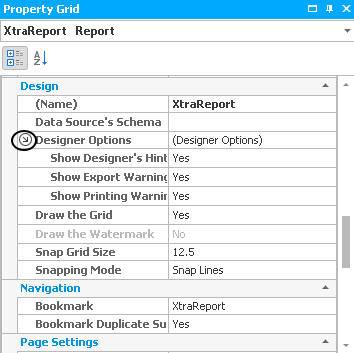
Here you have the possibility to display a Printing Warning, an Export Warning and Designer's Hints.
Under Snap Grid Size you set how wide the grid should be that is displayed. This grid is for orientation and a better placing of elements. If you do not want to use this feature choose No for Draw the Grid.
In the section Parameters you click on the row Parameters and the three dots. The following window opens:
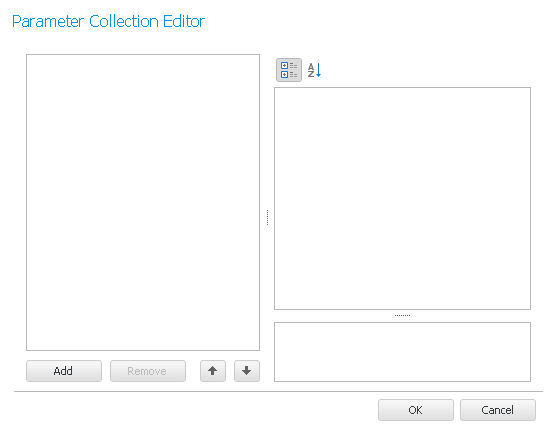
Click on Add to create a new parameter. On the right you have the possibility to edit it. Enter a Description for the parameter, choose the Type, for example String, and type in the Value. Finally, you enter a name for the parameter.
You can also delete previously created parameters by clicking on Remove.
Once you set everything click on OK.
The next thing you can do is set that the parameter is requested when you switch to the preview or HTML view. Then no pages will appear until you submit the parameter values:

In the Page Settings section you can choose the printer that should be used in the row printer name. For Paper Kind you pick the desired format, for example A4 or A5.
You can also decide if you want to use the Landscape format or not.
Then click on the arrow in front of Margins. Now enter the margin width for bottom, left, right and top.
These were the settings for the entire report.
