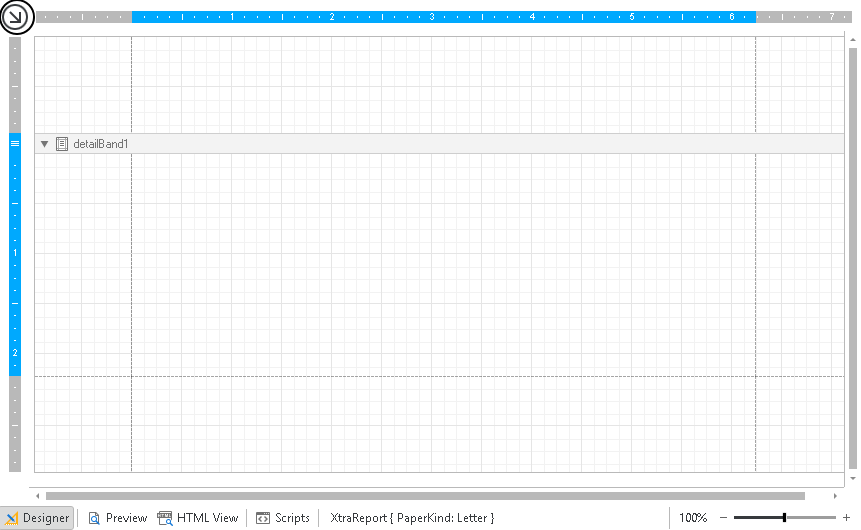
This is the display window of the professional report designer, here you can see the document:
First you have the TopMarginBand1. This is the area above the detailBand1. If you click on that area a blue border and a white arrow with a blue background will appear. Now click on the arrow:
You will now see the following list:
You can click on Edit and Reorder Bands. A dialog will open:
Here you have the possibility to change several things, like the background color or the border width for example. Next, you go on Close.
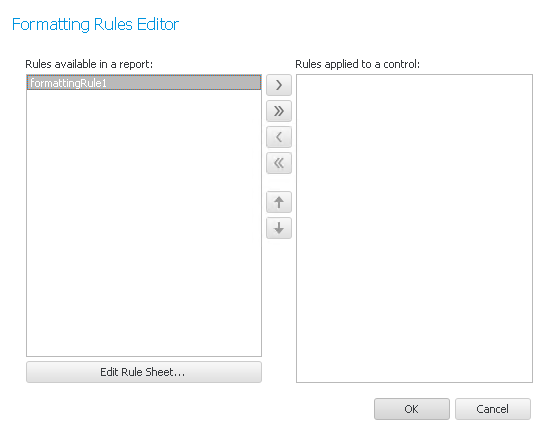
You can also click on the three dots behind Formatting Rules. The following window opens:
Click on Edit Rule Sheet:
Click on the green +. On the right you can then edit your formatting rule. Go on Close once you are done. You will get back to the previous window:
Select the formatting rule and click on the arrow to the right. Then you go on OK. You created a formatting rule for topMarginBand1.
The other bands also have configuration options.
For the detailBand1 you open the list again:
Under Edit and Reorder Bands you have, like for topMarginBand1, the possibility to edit this section. You are, for example, able to create certain formatting rules, as explained above.
For the bottom margin (bottomMarginBand1) you have the same features as for the top margin:
Via a right click you can access more features:
By clicking on Edit and Reorder Bands you get to the Report Editor where you can add, edit or remove bands for the report. If you go on Insert Band you will see all of the other bands you can insert. Click on one of them if you want to have it in your report. The topMarginBand1, the detailBand1 and the bottomMarginBand1 are already there, you can add the report header, the page header and the group header as well as the group footer, the report footer and the page footer. The report header and footer are sections that are at the very beginning or end of a report. There you can insert elements like in the other sections. If you divided your report in pages, meaning you inserted a page break, you are also able to insert a page header and footer. You also have the possibility to insert detail reports. These can be either unbound or bound to a field type from Act!, for example contacts or activities. Detail reports are again sections in the report.
Go on Zoom with your mouse and then on the particular zoom factor. You can also just zoom in or out of the report.
If you click on Properties the Property Grid will open where you can access further settings.
If you inserted new sections they will have the same configuration options.
With the row below the display window you can switch between the different view types. There is also the possibility to change the zoom.
The last feature of the display window are the general report tasks. You open the list with a click on the black arrow in the upper left corner:
That is what the list looks like:
The first option is Edit and Reorder Bands. With a click on it you open the report editor. For the data source you should have chosen dataSet1 which is the connection to Act!. Then you pick the desired measure units (pixels, hundredths of an inch, tenths of a millimeter). Via the three dots next to formatting rules you get to the particular dialog and can choose rules there. If you want to create new formatting rules click on the three dots behind Edit rule sheet. The last important feature here is the watermark. Go on the three dots and the following dialog opens:
For the watermark you can insert either a text or a picture. For a text you enter the desired character string first. Then you choose the direction, the font color, the font type and the size. You also have the possibility to make the lettering bold or italic. The transparency of the lettering can be adjusted with the controller, 0 means not transparent at all and 255 that the lettering is not visible anymore at all. Next, you state whether the lettering should be in front of or behind everything else and on which pages it should be visible.
Optionally, you can always insert a picture as a watermark. Click on the Picture watermark tab:
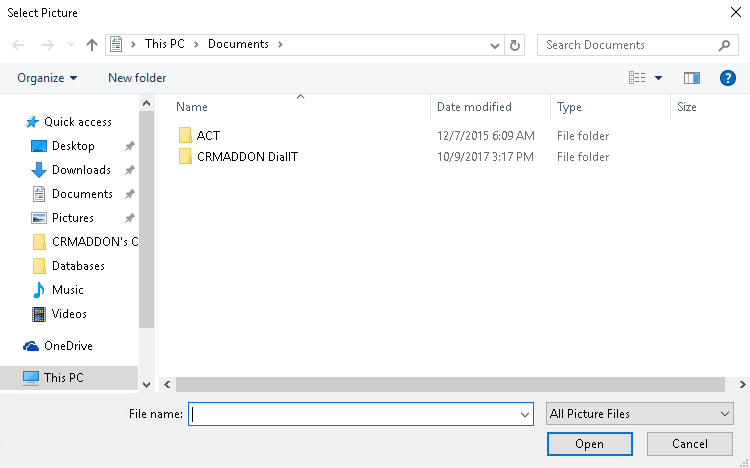
First you go on the Browse button. The following window opens:
There you choose the desired picture and then click on Open. You will get back to this dialog:
For size mode you choose from the list whether the picture should be clipped, stretched or zoomed (fit to the left and right side). If you tick Tiling the picture will be inserted into the report several times. In case you kept the original size of the picture you can choose, for the horizontal alignment, whether it should be on the right, on the left or centered. For the vertical alignment you have the options top, middle and bottom. Again, you can change the transparency with the controller as well as state the position of the picture and the page range where it should appear.
In the end you go on OK. You can look at the watermark in the preview mode.
These were all of the features of the display window. |