Click on the desired field in the Data Explorer, stay on the left mouse button and drag the field in your document. It will now appear in the form of a little table with a grey and a white row. The grey row is the so called ListHeader and the white row the DataRow. These names can be made visible via Highlight in the View tab. Now click on ListHeader. The List tab appears:

The first feature is the Header. Click on the symbol:

The header will be added automatically whenever you insert a field. You can either remove or, if you removed it previously, add it. A footer won't be added automatically but you can add it yourself by clicking on the symbol footer and then the option Add footer. You also have the possibility to delete it again with a click on Remove footer.
The next symbol is the separator. Click on it and the following list appears:

Here you choose how the different fields should be parted, either with a page break, a new section after every page, every even page or every odd page, an empty paragraph, an empty row or not at all (=none).
If you click on the Filter symbol this window appears:
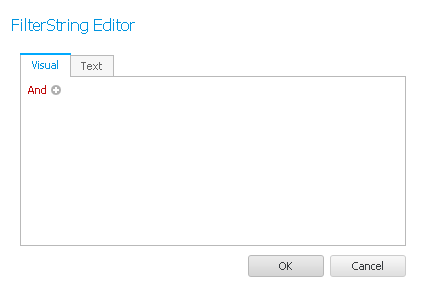
You can read about how to edit the filter in the Mail Merge tab.
If you click on Convert to paragraphs the table format of the field disappears and the information will appear as plain text instead, separated by paragraphs. This setting cannot be undone.
You remove the list by clicking on Delete list.
In the end you can choose how many rows should be displayed.
These were all the features of the List tab.
