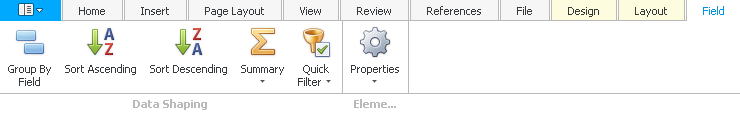
In the Field tab you can adjust the settings for some elements in your document.
The bar code
If you entered a bar code (see Insert tab) you get to the field tab by double clicking on the bar code. There you go on the symbol Properties. The following list appears:
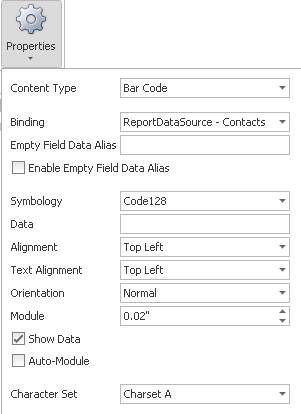
The content type should be chosen correctly already. Next, you enter the binding which will apply to the bar code. You can enter an empty field data alias. First, you tick Enable empty field data alias and then type in the character string that should replace the empty fields.
In the dropdown list for the symbology you choose a bar code type, for example Code 39. For data you enter the numbers and letters which should be displayed above the bar code. Then you set the alignment of the bar code and the alignment of the text above the bar code. In order to rotate the bar code choose an option for orientation.
You can also adjust the size of the bar code by entering a higher or lower number for module. It might happen that you see the following instead of the barcode afterwards:
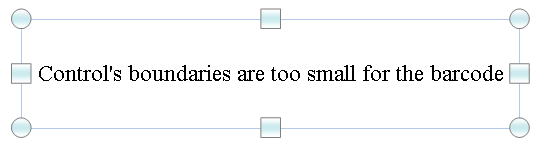
This means that the bar code is too big to be displayed in this frame. Just drag at the sides to make it visible again.
By ticking Show data you make sure that the previously entered data will be displayed above the bar code.
You can use Auto Module to adjust your bar code to the frame.
Finally, there are specific settings for the individual code types.
The check box
After you inserted it (see Insert tab) you click on it to get to the editing mode. Then you go on the Properties symbol. The following list appears:

First, you make sure that the right content type was selected. Then you enter the binding that should be checked. This field should be a Yes/No or True/False field. Like for the barcode you can decide on a empty field data alias after ticking Enable empty field data alias.
The row index
When you inserted the row index (see Insert tab) you click on it and the field tab will open. Then you go on the Properties symbol. You will see the following list:

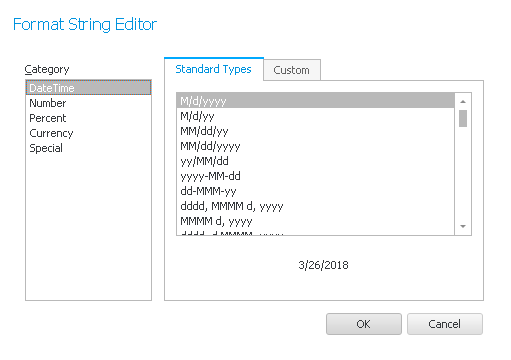
First you click on the three dots ... behind format string. This dialog appears:

You can now choose from date, number, percent, currency or a special format character string. On the right you pick a display mode, for example if the day or the month should apppear first for the date. There are also the standard types and the tab Custom where you can create your individual display mode. Once you are done click on OK.
In the group mode you also have the possibility to either restart the row index numbering or to continue with it.
The Sparkline
After you inserted it (see Insert tab) you click on it in order to get into the editing mode. Then you go on the Properties symbol. The following list appears:
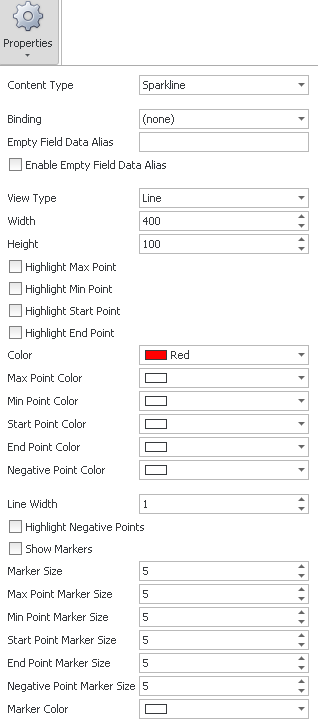
First, check if you have chosen the correct content type. Like for the bar code and the check box you can decide on an empty field data alias and enable the empty field data alias. Then you choose the view type, either Area, Line or Bar. You can also set the width and the height of the sparkline as well as Highlight the Max Point, the Min Point, the start and the end point. Then you choose a color for your sparkline. With a click on the arrow button you open the following dropdown list:
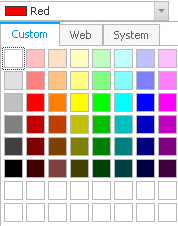
Either you choose a color here or you go on the Web tab. You will be here now:
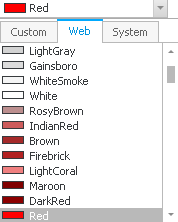
In case you could not decide on a color here, you click on the System tab. There you will see a long list of colors as well.
There is also the possibility to choose a color for the maximum, minimum, start and end point as well as the negative points.
Fields from the Data Explorer
Click on the desired field in the Data Explorer, stay on the left mouse button and drag the field in your document. It will appear in the form of a little table with grey rows and one white row. The grey row is the so called ListHeader and the white row the DataRow. These names can be made visible with the Highlight feature in the View Tab. Now click on DataRow. In the symbol bar the field tab will appear.
You can use the feature Group by field by clicking on the symbol:
You have the possibility to sort the data records in an ascending or a descending order. You can also combine the data. If you click on the Summary symbol the following list appears:
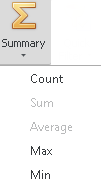
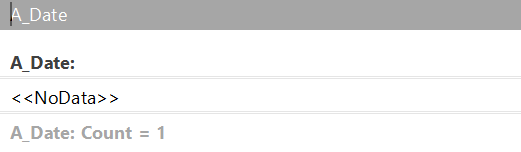
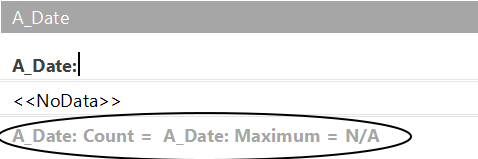
You can choose between displaying the number (=count) of data records, the maximum or the minimum data record. For types of data that contain numbers you may also choose sum or average. The summaries will appear below the DataRow of the field:
Another feature is the quick filter.

In the end you have the possibility to change the settings. Click on the Properties symbol and the dropdown list appears:
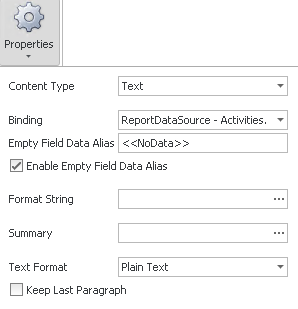
First, you need to make sure that you picked the correct content type.
Like for the bar code, sparkline and check box you can decide on an empty field data alias and enable this empty field data alias.
Next you click on the three dots behind format string:
Here you choose the desired format string like for the row index. Then you click on OK.
Now you go on the three dots behind summary. The following dialog will open:
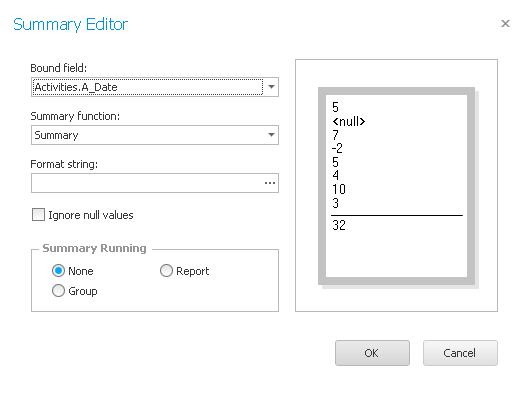
Choose the field the summary should apply to. Then you enter the summary function. You can choose between Summary, Minimum, Maximum, Count (=number), Average, Custom or None. Then you decide on a format string by clicking on the three dots. Proceed like it was explained for row index. Then you click on OK.
You also have the possibility to ignore null values.
For Summary Running you pick the area the summary should apply to, either None, the entire report or the group. In the end you go on OK.
Now you choose the text format from the list: Plain text, RTF, DOC, OpenXML, HTML, MHT, WordML or OpenDocument.
You can keep the last paragraph if you want to.
These were all the features of the field tab.
