We will now get to the expanded symbol bar:

Zip Code
With the symbol  you can insert zip codes. Pull up the element in the display window. When you click on the arrow in the upper right corner the following list appears:
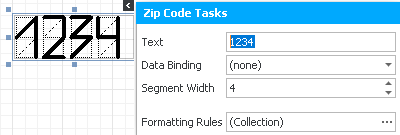
You can either enter the postal code manually (text) or create a data binding with the zip code field from Act!. The segment width states how many digits the postal code should have. If you want to you can add new formatting rules.
You can inform yourself about further settings in the chapter Property Grid.
Chart
You can find out how to insert and edit a diagram in the sub chapter chart.
Gauge
With the  symbol you can insert a gauge. Pull up the element in the display window. In order to edit the gauge click on the blue button in the upper right corner of the element:
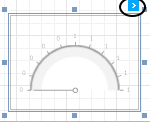
The following list will open:
Choose the view type and the view style. Then you pick a view theme. For the Actual value you enter the current value the gauge should display. The target value is the value you want to reach. The minimum or maximum limit the scale of values. Instead of having to type in a value manually you can also create a data binding.
Sparkline
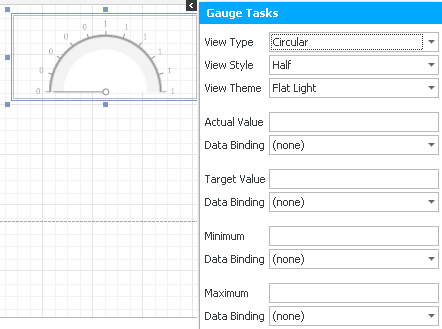
You have the possibility to insert a sparkline with the  symbol. Pull up the element in the display window and then click on the blue button with the arrow in order to open the following list:
Enter the data source, the data member, the data adapter and the value member whose information should be displayed in the graph. You also have the possibility to change the view, for example in area or bar.
Pivot grid
With the  symbol you can create a pivot grid. Pull up the table in the display window and click on the blue button with the arrow. The following list appears:
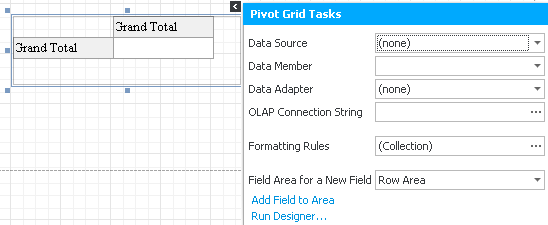
First you choose a data source and a data member. You can insert formatting rules if you want to. For Field area for a new field you pick an area and then you click on Add field to area. That way you create new fields for your table. To edit the table you go on Run designer. This dialog will open:
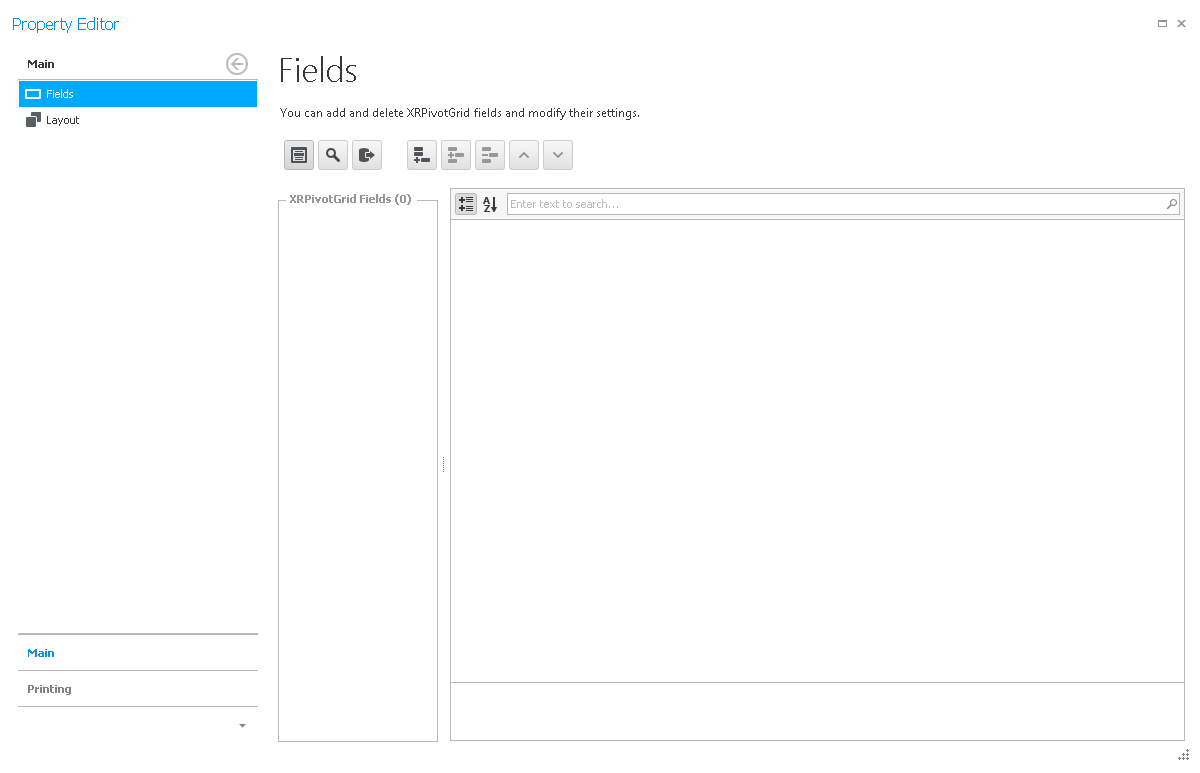
Click on the  symbol to display the field list. You can now move fields from Act! to the XRPivot-Gried fields list with drag and drop. These will then appear in the table. In order to move all of the Act! fields at once you can click on the
  symbol. With the
  symbol you insert the Act! field that you have selected. If you want to create a completely new table field go on this symbol:
  . To delete a field again click on the following symbol:
  . Once you created all of the fields for your pivot table click on Layout. There you can arrange the fields under the tab Grid preview. You can also save your layout or load it if you created one before. Under the tab Load data from XML you find a button you can upload an XML-file with that contains the layout of the table.
Close the window once you are done.
Further settings can be found in the chapter Property Grid.
Sub report
With the  symbol you can insert a sub report. Pull up the sub report in the display window.
Page info
With the  symbol you can insert page info. Pull up the element in the display window, then click on the blue button in the upper right corner of the element in order to open the following list:
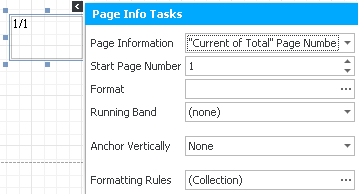
For the page info you can choose from different options, for example the page number, the time and the date or the user name.
In case you insert a page number you can state the number the numbering should start with (start number page). Go on the three dots ... next to format and a window opens:
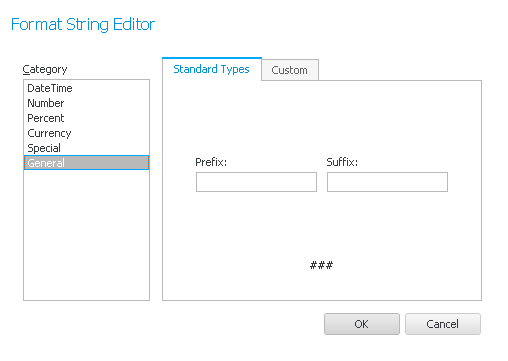
Here you can enter the format string type. Afterwards you click on OK.
Now you can change several formatting rules, for example the color of the frame. The explanations for that can be found in the sub chapter Picture element.
Further settings for the page information are explained in the Property Grid chapter.
Page break
Click on the  symbol and pull up the element in the display window to insert a page break.
Cross-band line
You can insert a continuous line with the  symbol. Pull it up in the display window.
More settings can be found in the chapter Property Grid.
Cross-band box
With the  symbol you can insert a frame. You can read about how to edit it in the Property Grid.
These were all of the features of the left symbol bar.
