Here you see the report explorer:
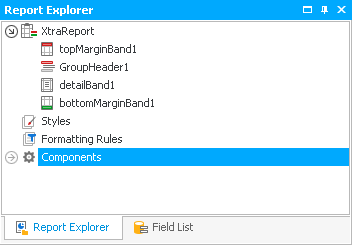
Depending on the bands you created you will find them listed here. By default you have the topMarginBand1, the bottomMarginBand1 and the detailBand1. You open the list of components with a click on the arrow button in front of it:
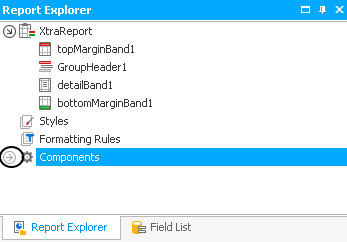
You should now see dataSet1 listed, this is the data from Act!.
If you inserted an element into one of the bands, for example a text element, it will appear below the particular band. Right click on it to access some features:
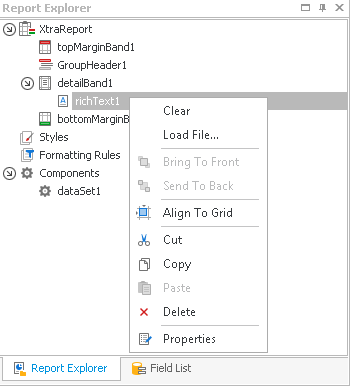
You can bring the element to the front or to the back, align it to the grid, cut, copy or delete it. With a click on Properties the particular settings will appear in the Property Grid. With drag and drop you have the possibility to move the individual elements between the different bands.
These were all of the features of the report explorer.
